The U.S. housing market’s trajectory tells a compelling story through its graphs, revealing critical patterns that shape investment decisions worth millions. Recent data visualizations showcase dramatic shifts in home prices, interest rates, and inventory levels, creating a complex narrative that demands careful interpretation. From the steep price appreciation curves of 2021 to the market’s current rebalancing phase, these graphs serve as essential tools for understanding market dynamics and predicting future trends.
Whether you’re a seasoned real estate professional analyzing market cycles or a potential homebuyer timing your purchase, understanding how to read and interpret housing market graphs has become increasingly crucial. These visual representations distill complex market forces – including mortgage rates, housing supply, demographic shifts, and regional variations – into actionable insights that drive informed decision-making.
As we examine the latest housing market graphs, we’ll uncover the key indicators that signal market shifts, identify emerging trends that could impact property values, and explore how these visual data points can guide strategic real estate decisions. This comprehensive analysis will help you navigate the current market landscape with greater confidence and precision.
Current U.S. Housing Market Trajectory
Price Appreciation Patterns
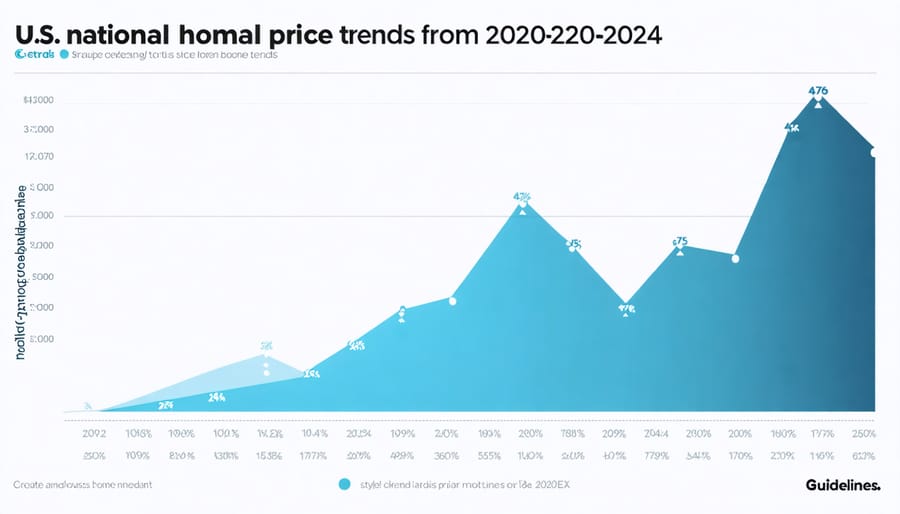
The U.S. housing market has exhibited distinct price appreciation patterns over the past decades, with historical market trends showing both consistent growth periods and notable fluctuations. Coastal markets, particularly in California and the Northeast, have traditionally experienced steeper appreciation curves compared to inland regions. This pattern reflects population density, job market strength, and limited housing supply in these areas.
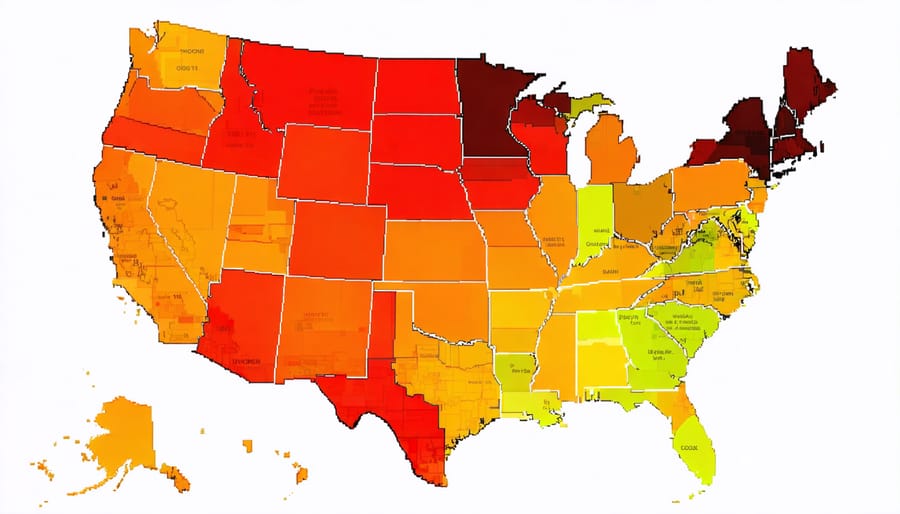
Recent data reveals an interesting shift in these traditional patterns. While metropolitan areas continue to show strong price appreciation, secondary markets and suburban regions have emerged as powerful growth centers, particularly following the COVID-19 pandemic. The Sun Belt states, including Texas, Florida, and Arizona, have demonstrated remarkable price appreciation, often outpacing national averages.
Regional variations in price appreciation typically follow local economic indicators, with factors such as employment growth, population migration, and new construction rates playing crucial roles. Mountain states like Colorado and Utah have shown consistent upward trajectories, while Midwest markets tend to exhibit more stable, gradual appreciation patterns.
Market analysts have identified several key acceleration points where national housing prices saw significant upticks: the early 2000s housing boom, the post-2012 recovery period, and the unprecedented surge during 2020-2021. These patterns provide valuable insights for understanding current market dynamics and potential future trends.
Supply and Demand Metrics
Current housing market graphs reveal a complex interplay between supply and demand metrics, with inventory levels showing significant fluctuations throughout 2023. Active listings have decreased by approximately 15% compared to the previous year, creating a persistent supply shortage that continues to influence market dynamics.
The months’ supply of housing inventory, a crucial metric that measures how long it would take to sell all current listings at the present sales pace, hovers around 3.5 months – well below the 6-month benchmark that typically indicates a balanced market. This constraint in supply has maintained upward pressure on home prices despite higher mortgage rates.
Buyer demand indicators present a mixed picture, with pending home sales showing periodic spikes followed by periods of moderation. Web search trends and showing request data suggest sustained interest from potential buyers, though at lower levels than during the pandemic-era boom. First-time homebuyer activity has been particularly affected, representing about 30% of transactions compared to the historical norm of 40%.
New construction metrics offer a glimmer of hope for inventory relief, with housing starts trending upward in recent months. However, the pace of new completions remains insufficient to meet current demand levels, especially in high-growth metropolitan areas where population increases continue to outpace housing supply additions.
These supply-demand imbalances are clearly reflected in market absorption rates, which remain relatively quick despite higher financing costs, with the average days on market still below pre-pandemic levels in most regions.
Key Market Influences Shaping the Graph
Interest Rate Impact
The dramatic shifts in mortgage rates have become a defining factor in today’s housing market dynamics. As interest rates affect real estate markets, we’re witnessing unprecedented impacts on both buying power and seller behavior. The recent surge in mortgage rates to over 7% has effectively cooled what was once a red-hot market, leading to a significant slowdown in transaction volumes.
This rate environment has created a “lock-in effect,” where homeowners with existing low-rate mortgages (3% or lower) are reluctant to sell and take on new, higher-rate loans. As a result, housing inventory remains constrained, creating an interesting paradox: while higher rates typically decrease demand, limited supply is helping maintain price stability in many markets.
For buyers, the impact is particularly stark. The difference between a 3% and 7% mortgage rate on a $400,000 home can mean an additional $1,000 or more in monthly payments. This has forced many potential buyers to either postpone their purchases, adjust their price ranges downward, or explore alternative financing options like adjustable-rate mortgages.
Market analysts suggest this rate-driven transformation may persist until inflation shows sustained improvement, potentially reshaping traditional buying patterns and investment strategies for the foreseeable future.
Demographic Shifts
Demographic shifts are playing an increasingly pivotal role in shaping the U.S. housing market landscape. The largest generational cohort, millennials, has entered their prime homebuying years, creating unprecedented demand in suburban and mid-sized city markets. This generation, now aged 27-42, represents roughly 43% of all homebuyers, significantly influencing price trends and inventory availability.
Meanwhile, Baby Boomers’ retirement patterns are creating distinct market dynamics. Rather than downsizing as previous generations did, many are choosing to “age in place,” reducing available housing stock for younger buyers. This trend has contributed to the current inventory squeeze in many desirable markets.
Another significant demographic factor is the rise of remote work, which has fundamentally altered where people choose to live. Cities like Austin, Boise, and Nashville have experienced substantial population influxes as workers prioritize affordability and quality of life over proximity to traditional employment centers.
Immigration patterns also continue to impact housing demand, particularly in gateway cities and emerging multicultural hubs. Recent data shows that immigrant households represent about 14% of all U.S. homebuyers, with concentrated effects in markets like Miami, Houston, and San Jose.
Looking ahead, Generation Z’s gradual entry into the housing market, combined with evolving household formation patterns and increasing cultural diversity, suggests continued strong demand for housing, particularly in affordable, amenity-rich communities.
Economic Indicators
The U.S. housing market’s behavior is intrinsically linked to several key economic indicators that savvy real estate professionals and investors closely monitor. Interest rates stand as perhaps the most influential factor, with Federal Reserve policies directly impacting mortgage rates and, consequently, home affordability. When rates rise, buyer purchasing power typically decreases, often leading to downward pressure on home prices.
Employment data and wage growth also play crucial roles in housing market dynamics. Strong job markets and rising incomes generally support higher home prices, as more buyers enter the market with increased purchasing power. Meanwhile, inflation rates affect both construction costs and consumer spending patterns, ultimately influencing home values and market activity.
The Consumer Price Index (CPI) and GDP growth rates serve as reliable barometers for overall economic health, correlating strongly with housing market performance. During periods of robust economic growth, housing prices typically trend upward, while economic downturns often trigger market corrections.
Another significant indicator is housing inventory levels, which reflect the balance between supply and demand. Low inventory typically drives prices higher, while excess supply can lead to price reductions. Additionally, building permits and housing starts data provide valuable insights into future market supply, helping predict potential price movements and market conditions.
Regional Market Variations
Hot Markets vs. Cooling Markets
The U.S. housing market continues to display significant regional variations, with some areas experiencing sustained growth while others show signs of cooling. A comprehensive regional market analysis reveals that coastal metropolitan areas, particularly in the Southeast and Southwest, maintain robust price appreciation and high demand. Cities like Miami, Austin, and Phoenix lead the pack with double-digit price increases year-over-year.
In contrast, several formerly hot markets, including San Francisco and Seattle, have experienced notable slowdowns. These cooling trends are characterized by increased inventory levels, longer days on market, and more frequent price reductions. The Midwest region presents a more balanced picture, with steady but moderate growth in cities like Indianapolis and Kansas City.
Factors driving these regional differences include local economic conditions, population migration patterns, and housing affordability indexes. Hot markets typically benefit from strong job markets, population influx, and relatively lower housing costs compared to income levels. Cooling markets often struggle with affordability challenges, shifting workplace dynamics, and changing demographic preferences.
Understanding these regional variations is crucial for investors, homebuyers, and real estate professionals. While national trends provide a broad overview, local market conditions ultimately determine investment opportunities and risks in specific areas.
Urban vs. Suburban Trends
Recent housing market data reveals a significant shift in the traditional urban-suburban price dynamics. While city centers historically commanded premium prices, the post-pandemic landscape has introduced new patterns. Suburban home prices have experienced accelerated growth, with an average appreciation rate of 15-20% compared to urban areas’ 10-12% in many major metropolitan regions.
This suburban price surge stems from several factors: increased demand for larger living spaces, remote work flexibility, and better price-per-square-foot value. Many buyers are willing to trade proximity to city centers for expanded outdoor areas and home offices, driving competitive bidding in previously overlooked suburban markets.
However, urban markets remain resilient in established tech and financial hubs. Cities like San Francisco, New York, and Boston maintain their premium pricing despite temporary pandemic-related dips. The urban luxury segment has shown particular strength, with high-end condominiums and penthouses recovering faster than mid-range urban properties.
Interestingly, mid-tier suburban markets within 30-45 minutes of major employment centers have emerged as sweet spots for appreciation. These areas offer a balance of accessibility and affordability that appeals to both millennials entering their prime homebuying years and downsizing baby boomers.
Looking forward, experts predict this urban-suburban price gap will continue to narrow, especially in regions with strong public transportation infrastructure and developing suburban business districts.
Future Market Projections
Based on latest housing price forecasts, the U.S. housing market is expected to experience moderate price appreciation through 2024-2025, though at a more sustainable pace than the dramatic increases seen in recent years. Most industry analysts project annual home price growth between 2.5% and 3.8%, reflecting a stabilizing market rather than the volatile swings of the past.
Key indicators suggest that while inventory constraints will continue to support prices, rising interest rates may temper demand. The millennial generation’s peak homebuying years, combined with persistent housing shortages, should maintain upward pressure on values in most metropolitan areas. However, regional variations will become more pronounced, with some markets potentially seeing slight corrections while others continue steady appreciation.
Affordability challenges are expected to reshape market dynamics, potentially driving increased demand for smaller homes and properties in secondary markets. The graphs indicate a likely shift toward more balanced conditions, though not necessarily a buyer’s market. First-time homebuyers may find some relief as price growth moderates and new construction gradually adds to inventory.
Looking further ahead, demographic trends and economic fundamentals point to sustained long-term demand, particularly in suburban and sunbelt markets. While the rapid price escalation of recent years isn’t likely to repeat, the market is expected to maintain its historical pattern of appreciation, averaging 3-4% annually over the next five years, barring any major economic disruptions.
Understanding the U.S. housing market through graphical analysis reveals several critical insights that can guide your real estate decisions. The data clearly shows cyclical patterns in home prices, with current trends indicating a complex market environment shaped by interest rates, inventory levels, and demographic shifts. For real estate professionals and potential buyers, these visualizations serve as essential tools for timing market entry and exit points.
Moving forward, it’s crucial to monitor key indicators such as price-to-rent ratios, mortgage rate trends, and regional market variations. Successful navigation of the housing market requires a balanced approach: stay informed about national trends while paying close attention to local market dynamics. Consider establishing price alerts, maintaining relationships with local real estate professionals, and regularly reviewing market reports to stay ahead of emerging trends.
Remember that graphs and charts are valuable decision-making tools, but they should be part of a broader analysis that includes local economic conditions, personal financial circumstances, and long-term investment goals. Whether you’re a first-time homebuyer, seasoned investor, or industry professional, combining these insights with proper due diligence will help you make more informed real estate decisions in today’s dynamic market environment.